Forecasting the UEFA Euro 2024 with a machine learning ensemble
Winning probabilities
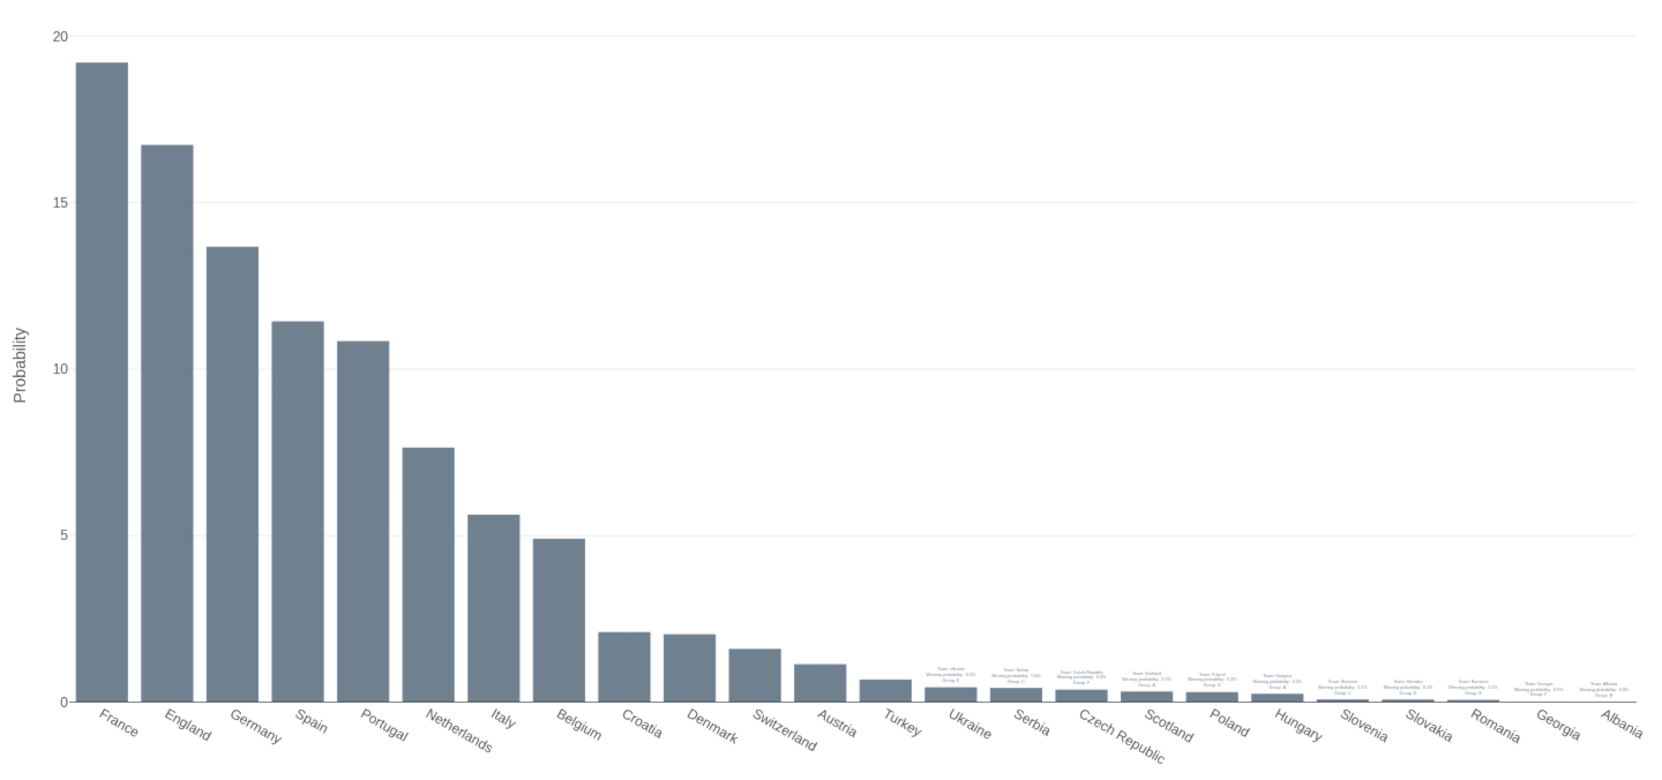
The forecast is based on an ensemble of machine learners that blend four main sources of information: An ability estimate for every team based on historic matches; an ability estimate for every team based on odds from 28 bookmakers; average ratings of the players in each team based on their individual performances in their home clubs and national teams; further team and country covariates (e.g., market value or GDP). An ensemble of machine learners is trained on the results of the UEFA Euro tournaments from 2004 to 2020 and then applied to current information to obtain a forecast for the UEFA Euro 2024. More specifically, the ensemble estimates the predicted number of goals for all possible matches between all 24 teams in the tournament. Based on the predicted goals the probabilities for a win, draw, or loss in each of these matches can be computed from a bivariate Poisson distribution. This allows us to simulate all matches in the group phase and which teams proceed to the knock out stage and who eventually wins. Repeating the simulation 100,000 times yields winning probabilities for each team. The results show that France is the favorite for the European title with a winning probability of 19.2%, followed by England with 16.7%, and host Germany with 13.7%. The winning probabilities for all teams are shown in the barchart below with more information linked in the interactive full-width version.
Interactive full-width graphic
The study has been conducted by an international team of researchers: Florian Felice, Andreas Groll, Lars Magnus Hvattum, Christophe Ley, Gunther Schauberger, Jonas Sternemann, Achim Zeileis. The basic idea for the forecast is to proceed in two steps. In the first step, three sophisticated statistical models are employed to determine the strengths of all teams and their players using disparate sets of information. In the second step, an ensemble of machine learners decide how to best combine the three strength estimates with other information about the teams.
-
Historic match abilities:
An ability estimate is obtained for every team based on “retrospective” data, namely all historic national matches over the last 8 years. A bivariate Poisson model with team-specific fixed effects is fitted to the number of goals scored by both teams in each match. However, rather than equally weighting all matches to obtain average team abilities (or team strengths) over the entire history period, an exponential weighting scheme is employed. This assigns more weight to more recent results and thus yields an estimate of current team abilities. More details can be found in Ley, Van de Wiele, Van Eetvelde (2019). -
Bookmaker consensus abilities:
Another ability estimate for every team is obtained based on “prospective” data, namely the odds of 28 international bookmakers that reflect their expert expectations for the tournament. Using the bookmaker consensus model of Leitner, Zeileis, Hornik (2010), the bookmaker odds are first adjusted for the bookmakers’ profit margins (“overround”) and then averaged (on a logit scale) to obtain a consensus for the winning probability of each team. To adjust for the effects of the tournament draw (that might have led to easier or harder groups for some teams), an “inverse” simulation approach is used to infer which team abilities are most likely to lead up to the consensus winning probabilities. -
Average player ratings:
To infer the contributions of individual players in a match, the plus-minus player ratings of Pantuso & Hvattum (2021) dissect all matches with a certain player (both on club and on national level) into segments, e.g., between substitutions. Subsequently, the goal difference achieved in these segments is linked to the presence of the individual players during that segment. This yields individual ratings for all players that can be aggregated to average player ratings for each team. -
Machine learning ensemble:
Finally, an ensemble of different machine learning methods is used to combine these three highly aggregated and informative variables above along with various further relevant variables, yielding refined probabilistic forecasts for each match. Such an approach was first suggested by Groll, Ley, Schauberger, Van Eetvelde (2019) and subsequently improved collaboratively. The ensemble of machine learners is trained to decide how to blend the different ability estimates with team-specific features that are typically less informative but still powerful enough to enhance the forecasts. The features considered comprise team- and country-specific details (market value, FIFA rank, UEFA points, number of Champions League players, and GDP per capita). By combining a large ensemble of machine learners, each of which employs the available information somewhat differently, the relative importances of all the covariates can be inferred automatically. The resulting predicted number of goals for each team can then finally be used to simulate the entire tournament 100,000 times.
Match probabilities
Using the forecasts from the machine learning ensemble yields the predicted number of goals for both teams in each possible match. The explanatory information used for this is the difference between the two teams in each of the variables listed above, i.e., the difference in historic match abilities (on a log scale), the difference in bookmaker consensus abilities (on a log scale), difference in average player ratings of the teams, etc. Assuming a bivariate Poisson distribution with the predicted numbers of goals for both teams, we can compute the probability that a certain match ends in a win, a draw, or a loss. The same can be repeated in overtime, if necessary, and a coin flip is used to decide penalties, if needed.
The following heatmap shows for each possible combination of teams the probability that one team beats the other team in a knockout match. The color scheme uses green vs. purple to signal probabilities above vs. below 50%, respectively. The tooltips for each match in the interactive version of the graphic also print the probabilities for the match to end in a win, draw, or loss after normal time.
Interactive full-width graphic
Performance throughout the tournament
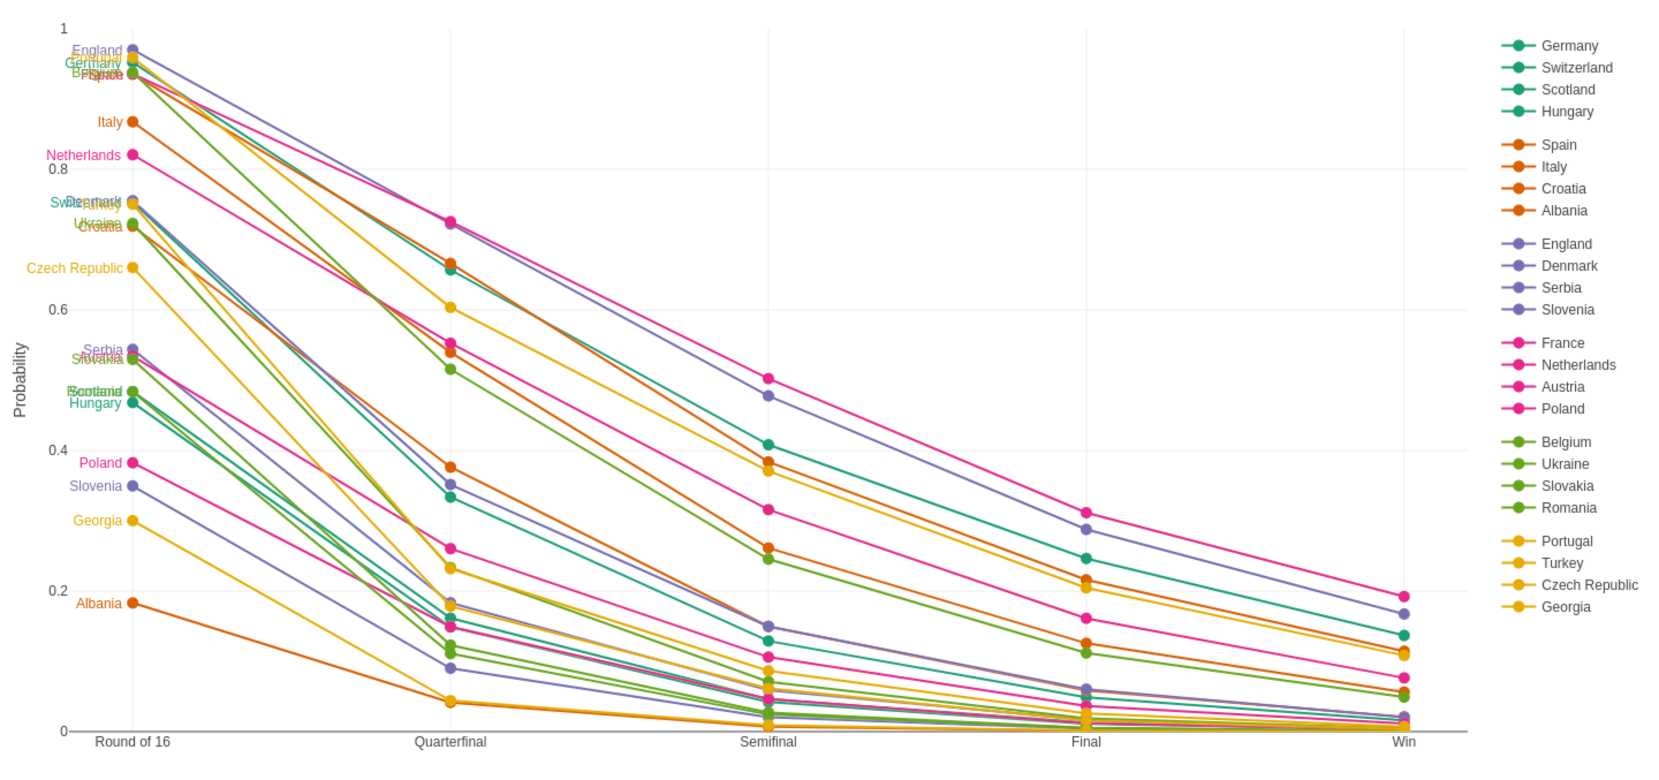
As every single match can be simulated with the pairwise probabilities above, it is also straightfoward to simulate the entire tournament (here: 100,000 times) providing “survival” probabilities for each team across the different stages.
Interactive full-width graphic
Odds and ends
All our forecasts are probabilistic, clearly below 100%, and by no means certain. Thus, although we can quantify this uncertainty in terms of probabilities from an ensemble of potential tournaments, it is far from being predetermined which of these potential tournaments we will eventually see during the actual tournament.
Nevertheless the probabilistic view provides us with some interesting insights: For example, while most bookmakers favor England over France, our model reverses their roles. In a potential final between the two teams, however, France would only have a small advantage with a winning probability of 53.2%. Due to the tournament draw it is relatively unlikely, though, that the two top favorites play the final and much more likely (with a probability of 12.6%) that they play the second semifinal. Somewhat surprisingly, the most likely final (5.4%) is England vs. Germany where the winning probabilities would be almost exactly fifty-fifty.
It is also somewhat unexpected that defending champion Italy has only the 7th-highest probability of winning the championship again (5.6%). This is due to the substantial changes the team underwent in the last three years.
In any case, all of this means that the probabilistic forecasts leave a lot of room for surprises and excitement during the UEFA Euro 2024. But what is absolutely certain is that we look forward to an entertaining tournament as football fans (much more than as professional forecasters).


