Amplification of Lightning in the European Alps 1980-2019
Citation
Thorsten Simon, Georg J. Mayr, Deborah Morgenstern, Nikolaus Umlauf, Achim Zeileis (2023). “Amplification of Annual and Diurnal Cycles of Alpine Lightning.” Climate Dynamics, Forthcoming. doi:10.1007/s00382-023-06786-8
Abstract
The response of lightning to a changing climate is not fully understood. Historic trends of proxies known for fostering convective environments suggest an increase of lightning over large parts of Europe. Since lightning results from the interaction of processes on many scales, as many of these processes as possible must be considered for a comprehensive answer. Recent achievements of decade-long seamless lightning measurements and hourly reanalyses of atmospheric conditions including cloud micro-physics combined with flexible regression techniques have made a reliable reconstruction of cloud-to-ground lightning down to its seasonally varying diurnal cycle feasible. The European Eastern Alps and their surroundings are chosen as reconstruction region since this domain includes a large variety of land-cover, topographical and atmospheric circulation conditions. The most intense changes over the four decades from 1980 to 2019 occurred over the high Alps where lightning activity doubled in the 2010s compared to the 1980s. There, the lightning season reaches a higher maximum and starts one month earlier. Diurnally, the peak is up to 50% stronger with more lightning strikes in the afternoon and evening hours. Signals along the southern and northern alpine rim are similar but weaker whereas the flatlands surrounding the Alps have no significant trend.
Software
R packages bamlss (CRAN, Web page) and mgcv (CRAN).
Highlights
The study links two sources of information which are both available in a spatio-temporal resolution of 32 km x 32 km and one hour:
- Measurements from the lightning location system ALDIS, available in homogenous quality for the period 2010-2019.
- 40 single-level atmospheric parameters from ECMWF’s fifth reanalysis (ERA5), available from 1980 onward, along with 45 further atmospheric variables derived from vertical profiles etc.
The idea is to learn the link between the lightning observations and the ERA5 atmospheric parameters on the time period where both data sources are available (2010-2019). Subsequently, probabilistic predictions can be made for lightning occurrence on the entire time period starting in 1980, i.e., including the period where only atmospheric parameters but no high-quality lightning detection observations are available. This then allows to track how the probability for lightning occurrence has evolved over the decades, both in terms of the annual seasonal cycles and the diurnal cycle.
The probabilistic model learned on this challenging data set is a generalized additive model (GAM) using a binary logit link and smooth spline terms for all explanatory variables based on the atmospheric parameters and additional spatio-temporal information. In order to deal with variable selection due to the large number of explanatory variables, the model is estimated by gradient boosting (as opposed to the classical maximum likelihood technique) combined with stability selection. These have been implemented using the R packages mgcv and bamlss.
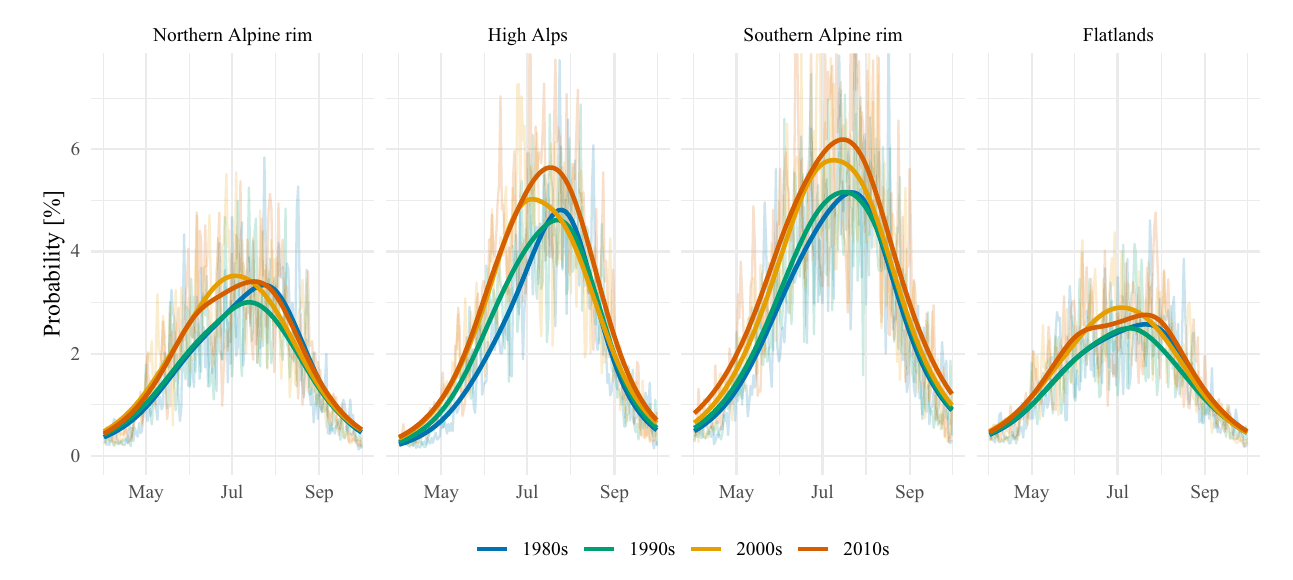
Based on the probabilistic predictions from this boosted binary GAM, the figure below shows reconstructed annual cycles of probabilities for lightning events averaged over the four decades from 1980s to 2010s (color coded). The light curves in the background are aggregations to the day of the year. The dark curves in the foreground are smoothed versions of the light curves. This shows that the peak in summer is much more pronounced and starts earlier for the High Alps and the Southern Alpine rim while there are only minor changes at the Northern Alpine rim and the surrounding flatlands.
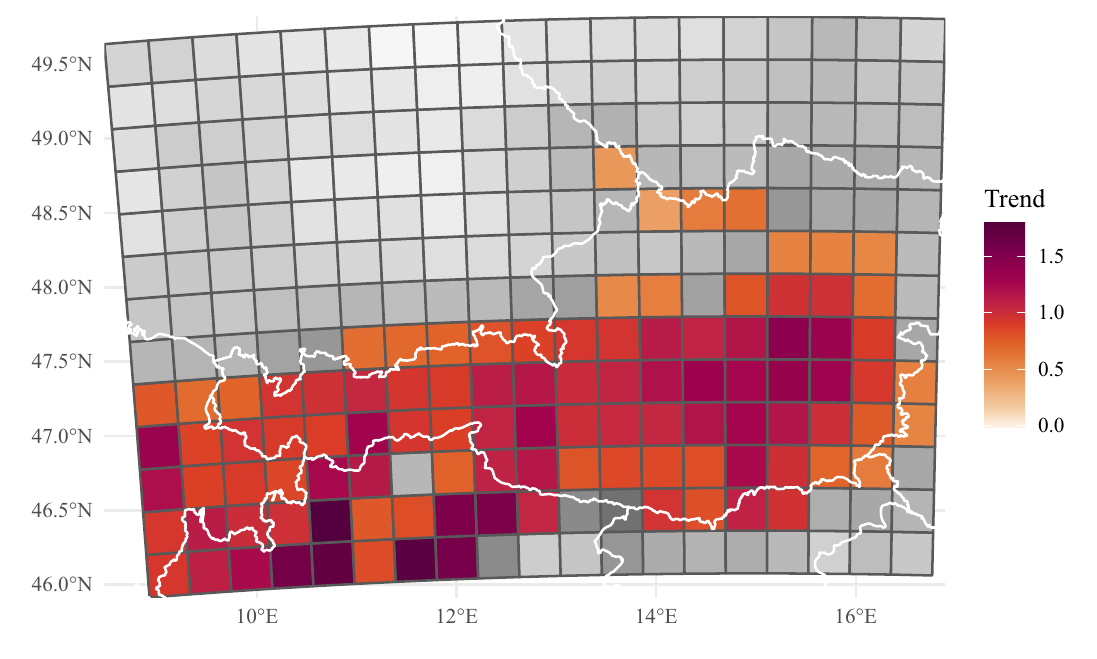
To aggregate these changes even further and capture climate changes, linear trends are fitted to the reconstructed probabilities for June (afternoons, 13-19 UTC) over time. The figure below shows the spatial distribution of these linear climate trends: Color luminance gives the slope per decade of a linear regression for mean probability of lightning within an hour in percent. Desaturated colors in the grids indicate that the linear trends for these grids are not significant at the 5% level. Again, this highlights the pronounced changes in the High Alps and the Southern Alpine rim while there are no significant changes in the surrounding flatlands.
For more details and further insights see the full paper linked above.